Research & Analysis Menu

Shift-Share Analysis of Texas Employment Growth and Shift Share Analysis Tools for Texas
Texas

Introduction & Summary

Shift-share analysis produces results that can be valuable for diagnosing, describing and building understanding of major differences between the industry pattern of employment growth locally and nationwide trends. Choose from Texas' 254 counties, select any time interval between 1969-2000 under the Standard Industrial Classification (SIC) or from 2001-2022 under the North American Industrial Classification System (NAICS), and generate shift-share analysis results for local employment growth compared with the nation at large. This module outputs graphical representations of employment growth for the given time interval, a tabular summary of shift-share results, a tailored disucssion on how to interprete the results, and a thorough technical summary of how the results are derived.

Directions

  1. Click to view one or more of the regional classifications listed below or from the "Analysis Options Menu" to the right. (Note: You may need to scroll down to view the entire selection menu.)
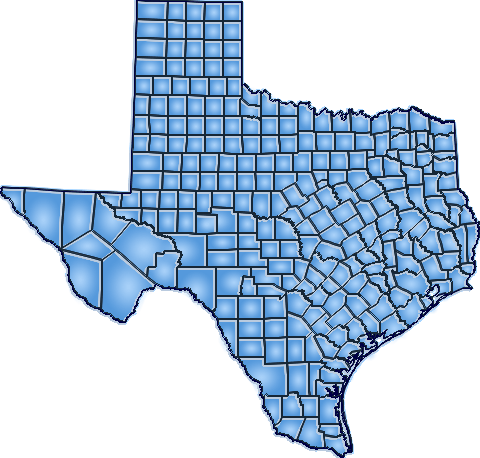
  2. From the map above or the "Analysis Options Menu" to the right, select a region that you wish to examine in your analysis.

Additional Suggested Analysis

To view and examine the short vs. long term growth of all 254 Texas counties click on the graph below.

Total Employment Growth by County

County vs Statewide Average: 2013-2021 and 2022

Total Employment by County
Brought To You By:

Shift share analysis and shift share tools brought to you by REAP provide shift share analysis of selected regions for total employment growth. Shift share analysis or Shift-share analysis provided on this website display an overview of how shift share analysis results are calculated and more detailed shift share analysis results in various data tables. Shift share formulas are also provided to demontrate the shift share calulations for the shift share statistics shown.

If you would like more information on shift share analysis, shift share formulas, or just general information of shift share, please contact us.

Analysis Options Menu
Select Year Interval
to
Select Region
AndersonKarnes
AndrewsKaufman
AngelinaKendall
AransasKenedy
ArcherKent
ArmstrongKerr
AtascosaKimble
AustinKing
BaileyKinney
BanderaKleberg
BastropKnox
BaylorLamar
BeeLamb
BellLampasas
BexarLa Salle
BlancoLavaca
BordenLee
BosqueLeon
BowieLiberty
BrazoriaLimestone
BrazosLipscomb
BrewsterLive Oak
BriscoeLlano
BrooksLoving
BrownLubbock
BurlesonLynn
BurnetMcCulloch
CaldwellMcLennan
CalhounMcMullen
CallahanMadison
CameronMarion
CampMartin
CarsonMason
CassMatagorda
CastroMaverick
ChambersMedina
CherokeeMenard
ChildressMidland
ClayMilam
CochranMills
CokeMitchell
ColemanMontague
CollinMontgomery
CollingsworthMoore
ColoradoMorris
ComalMotley
ComancheNacogdoches
ConchoNavarro
CookeNewton
CoryellNolan
CottleNueces
CraneOchiltree
CrockettOldham
CrosbyOrange
CulbersonPalo Pinto
DallamPanola
DallasParker
DawsonParmer
Deaf SmithPecos
DeltaPolk
DentonPotter
DeWittPresidio
DickensRains
DimmitRandall
DonleyReagan
DuvalReal
EastlandRed River
EctorReeves
EdwardsRefugio
EllisRoberts
El PasoRobertson
ErathRockwall
FallsRunnels
FanninRusk
FayetteSabine
FisherSan Augustine
FloydSan Jacinto
FoardSan Patricio
Fort BendSan Saba
FranklinSchleicher
FreestoneScurry
FrioShackelford
GainesShelby
GalvestonSherman
GarzaSmith
GillespieSomervell
GlasscockStarr
GoliadStephens
GonzalesSterling
GrayStonewall
GraysonSutton
GreggSwisher
GrimesTarrant
GuadalupeTaylor
HaleTerrell
HallTerry
HamiltonThrockmorton
HansfordTitus
HardemanTom Green
HardinTravis
HarrisTrinity
HarrisonTyler
HartleyUpshur
HaskellUpton
HaysUvalde
HemphillVal Verde
HendersonVan Zandt
HidalgoVictoria
HillWalker
HockleyWaller
HoodWard
HopkinsWashington
HoustonWebb
HowardWharton
HudspethWheeler
HuntWichita
HutchinsonWilbarger
IrionWillacy
JackWilliamson
JacksonWilson
JasperWinkler
Jeff DavisWise
JeffersonWood
Jim HoggYoakum
Jim WellsYoung
JohnsonZapata
JonesZavala
Copyright © 2024. Pacific Northwest Regional Economic Analysis Project (PNREAP). All Rights Reserved.

Please stay tuned...
while your request is processing:

Please wait while your request is being processed...
To offer the most comprehensive set of interactive options in support of your research, TX-REAP calculates and crunches most of the data and generates the narrative and graphic analysis on demand in response to your request.
Your request will soon be available.
Just a few more seconds....Your request has been generated and is now loading the results.