Introduction & Summary
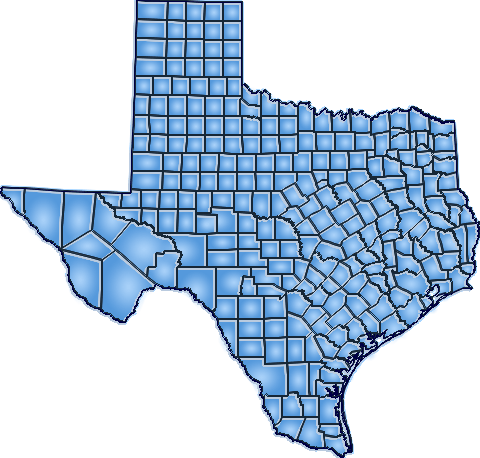
Analyze and investigate Texas' industry structure and performance of any county economy over 1969-2022. Choose and compare among three alternative measures: Employment, Earnings and Average Earnings Per Job. Location quotients help you diagnose and identify those industries where economic activity is most concentrated. Individual industry growth rates are benchmarked against the overall average, and to their counterparts nationally, to guide you in pinpointing those industries that have led, and those that have lagged.
Structure and Performance Across Industry Sectors
for a Selected County or Region
Select an indicator of interest to contrast and compare findings and results across all industry sectors for employment, earnings, average earnings per job, or gross domestic product.
Directions
- From the "Analysis Options Menu" to the right, select an individual region of interest to contrast and compare findings and industry results.
Additional Notes on Average Earnings Per Job
Average Earnings Per Job are computed by dividing BEA industry earnings estimate by BEA total full- and part-time jobs estimates. No convenient or adequate means exist at the county or regional level for converting the job estimates to a full-time equivalent measure. So, interpret the average earnings per job estimates with caution in consideration of the following issues:
- Average earnings per job within industries involving more part-time work is lower than industries involving more full-time work, although there could be little difference in the underlying wage of full-time workers. Such differences could also prevail between counties and regions. An increase in the proportion of part-time jobs over time may erode average earnings per job estimates, although full-time earnings per worker may have remained unchanged
- As with per capita income, average earnings per job may be subject to extreme short-run variation, especially in smaller counties. Unusual conditions such as droughts, hurricanes and bumper crops give rise to wide variations in average earnings per job. Also, major construction projects relating to building dams, nuclear power plants, and private plant construction projects have caused extreme fluctuations in many smaller states. Such changes typify both small and large agriculture-dependent counties and regions owing to the extreme annual variations in farm incomes.
- Since average earnings per job are just a simple average, it does not account for variations in the distribution of earnings among high- vs. low-wage jobs.
- The earnings by major industry estimates compiled by the Bureau of Economic Analysis (BEA) are by place are the sum of wage and salary disbursements (payrolls), supplement to wages and salaries, and proprietors' income. The 2022 earnings by industry data are in expressed in thousands of current dollars ($1,000s). Unlike wage and salary disbursement, it should be noted that proprietors' income may be reported as negative for those years in which the net income of sole propietor and partnerships are in the red for a particular sector. This is not an especially unusual occurrence in some relatively small counties where farm proprietorships are dominant. However, this may yield some somewhat unconventional results, such as an industry recording a negative share of total earnings or a location quotient that is negative.


